How to Keep a Trading Journal and Measure Whether Your Strategy Is Improving
Last checked: 11 October 2026. This guide describes a practical journal and the metrics commonly used to review trading results. The templates are suggestions to adapt. Educational content only, not financial advice. Trading leveraged products such as forex and CFDs carries a high risk of loss. European regulators have reported that 74 to 89 percent of retail CFD accounts lose money, and past results never guarantee future results.
Ask a trader whether they are improving and most will answer from memory, which is the least reliable source. Memory favours the dramatic trade, the big win or the painful loss, and forgets the dull average. A trading journal replaces that memory with a record. Done well, it shows what your strategy actually produces, which mistakes repeat and whether a change you made really helped. This guide explains what to record, which metrics to calculate, how to run a weekly review and how to tell whether you are improving or just having a good month.
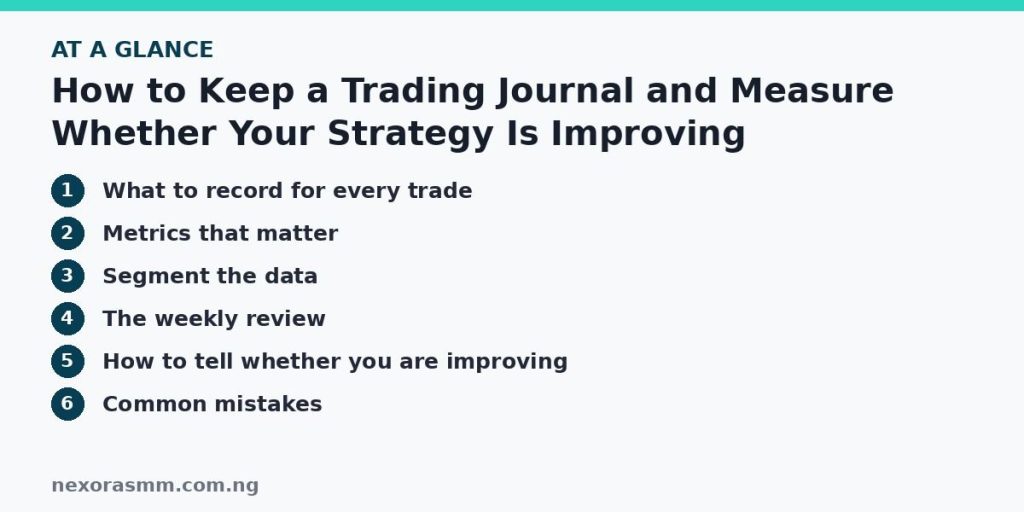
What to record for every trade
- Setup details: date, time, instrument, direction, the setup name from your plan and a chart screenshot with entry, stop and target marked.
- Plan numbers: entry price, stop loss, take profit, planned risk in money and percent, lot size and the planned reward-to-risk ratio.
- Result: exit price, profit or loss in money and in R, and how the trade ended (stop, target, manual exit).
- Rule adherence: a simple yes or no for “did I follow the plan on entry, stop and exit?”
- Context: higher-timeframe trend, market state (trending or ranging), news nearby and spread.
- Emotional state: before, during and after, in one or two words. Journaling guides stress that behaviour patterns often explain results better than setups do.
A spreadsheet is enough. Some traders use journaling software that calculates metrics automatically.
Metrics that matter
- Win rate: the share of trades that make a profit. On its own it can mislead.
- Average win and average loss (or average R), and the ratio between them.
- Expectancy: win rate times average win, minus loss rate times average loss. In the example of a 40 percent win rate with +2R winners and -1R losers, expectancy is +0.20R per trade.
- Profit factor: gross profit divided by gross loss. One guide treats above 1.5 as good, but the right level depends on your strategy and costs.
- Maximum drawdown: the worst peak-to-trough fall in the account.
- Longest losing streak and recovery time.
- Rule-adherence rate: the share of trades where you followed the plan completely.
Segment the data
Overall figures hide the truth. Journal guides recommend filtering by setup, session, instrument and time of day. A 50 percent overall win rate could hide a breakout setup that wins 65 percent and a reversal setup that wins 30 percent. One example described a trader whose profit factor was strong before late morning and poor in the afternoon, a leak that overall numbers did not show. Tag each trade so you can filter later.
The weekly review
- Look at the whole week in a calendar or list view, not only the losers. Reviewing only after a bad day gives a biased picture.
- Compare key metrics (win rate, expectancy, average R, drawdown) with your rolling average over the last 30 days or 30 trades. A 45 percent week is normal if your 30-day average is 48 percent.
- Check rule adherence. Separate losses that followed the plan from losses that broke it.
- Find one pattern. For example, “I moved stops on three trades” or “I overtraded after a loss”.
- Choose one specific change for the coming week, such as “no trades after two losses”, and write it down.
A monthly review can look at longer patterns and decide whether the plan needs a change. Avoid changing rules in response to a few trades.
How to tell whether you are improving
Improvement means better behaviour and, over a large enough sample, better expectancy. Watch these signs:
- Your rule-adherence rate is rising, especially after losses.
- Your average loss is close to your planned risk and no longer larger than 1R.
- Your rolling 30-trade expectancy is stable or rising, while your risk per trade has not been increased.
- Your maximum drawdown is smaller or recovered faster.
- You take fewer low-quality trades. Some guides suggest grading each setup’s quality and checking whether higher grades have higher expectancy.
Be careful with small samples. One good month proves little, because normal variance can produce it. Compare like with like: same strategy, same risk and a similar number of trades.
Common mistakes
- Recording only wins, or only the trades you are proud of.
- Writing notes but never reviewing them.
- Tracking only profit and loss and not the process.
- Changing several things at once, so you cannot tell what helped.
- Letting the journal become a punishment. Its purpose is learning.
What this article cannot tell you
- Which metric thresholds are right for your strategy. Rules such as a profit factor above 1.5 are educational guidelines.
- How many trades make a reliable measure of improvement. It depends on how variable your results are.
- Whether journaling alone changes results. Guides report that reviewing is what drives improvement, but I found no controlled study.
Frequently asked questions
Do I need special software? No. A spreadsheet with screenshots can work. Software mainly saves time on calculations.
How often should I review? Many traders review weekly and monthly. Daily notes capture detail while it is fresh.
What if my metrics get worse? Check rule adherence first, then market conditions and costs. Change one thing at a time and judge it over a sample.
Key takeaways
A trading journal turns memory into data. Record every trade with its plan, result, rule adherence and emotional state, calculate expectancy, drawdown and adherence, segment by setup, review weekly and change one thing at a time. Judge improvement over a large enough sample, not on a good week.
Sources checked
- TradeZella, “The Weekly Trade Review Process That Actually Improves Your Trading”
- TradeZella, “Tips to Keep a Trading Journal That Actually Improves Your Results”
- Gotrade, “Trading Journal Explained: What to Record and Free Downloadable Template”
- VT Markets, “How to Review Your Trades And Actually Improve”
- TradingView educational posts on trading journals and performance optimisation
Educational content only — not financial advice. Income and savings results vary and are never guaranteed. How we write
Enjoyed this story?
Get the best stories delivered weekly.