What Is Risk-to-Reward Ratio? Practical Examples Using Stop Loss and Take Profit
Last checked: 11 October 2026. This guide uses simple numbers to show how stop loss, take profit and win rate combine. The examples are illustrations, not signals. Educational content only, not financial advice. Trading leveraged products such as forex and CFDs carries a high risk of loss. European regulators have reported that 74 to 89 percent of retail CFD accounts lose money, and past results never guarantee future results.
Every trade has a price where you admit you were wrong and a price where you take your gain. The distance between those two prices, compared with the distance to your entry, is the risk-to-reward ratio. It is simple to calculate and very often misused. Some traders treat 1:3 as a magic number, others ignore it completely. This guide explains what the ratio means, shows how it connects to win rate and walks through examples with a stop loss and a take profit, including the costs that quietly change the numbers.
The definition
Risk is the distance from your entry to your stop loss. Reward is the distance from your entry to your take profit. The ratio compares them. If you buy EUR/USD at 1.0850, place the stop at 1.0820 and the target at 1.0910, you risk 30 pips to make 60 pips. Reward divided by risk is 2, so the ratio is 1:2. In money terms, if that 30-pip stop costs you 1 percent of your account, a winner is worth 2 percent.
Traders often count in R, where 1R is the amount risked. A loser is -1R, and a 1:2 winner is +2R. Journals that track results in R make different strategies easy to compare.
Why win rate and ratio must be read together
A high ratio does not guarantee profit, and a high win rate does not either. They work together. The break-even win rate for a given ratio is 1 divided by (1 plus the ratio):
- 1:1 needs a win rate of 50 percent just to break even.
- 1:1.5 needs 40 percent.
- 1:2 needs about 33 percent.
- 1:3 needs 25 percent.
- A ratio below 1, such as 1:0.5, needs about 67 percent.
These figures ignore costs. Real trading adds spread, commission and slippage, so the real break-even win rate is higher.
Expectancy: the number that decides
Expectancy is the average result per trade, in R: win rate times average win, minus loss rate times average loss. One broker education example uses a 40 percent win rate with +2R winners and -1R losers: 0.4 times 2 minus 0.6 times 1 equals +0.20R per trade. A trader with a 60 percent win rate but winners worth only 0.5R has 0.6 times 0.5 minus 0.4 times 1, which is -0.10R per trade, a losing system despite winning most trades.
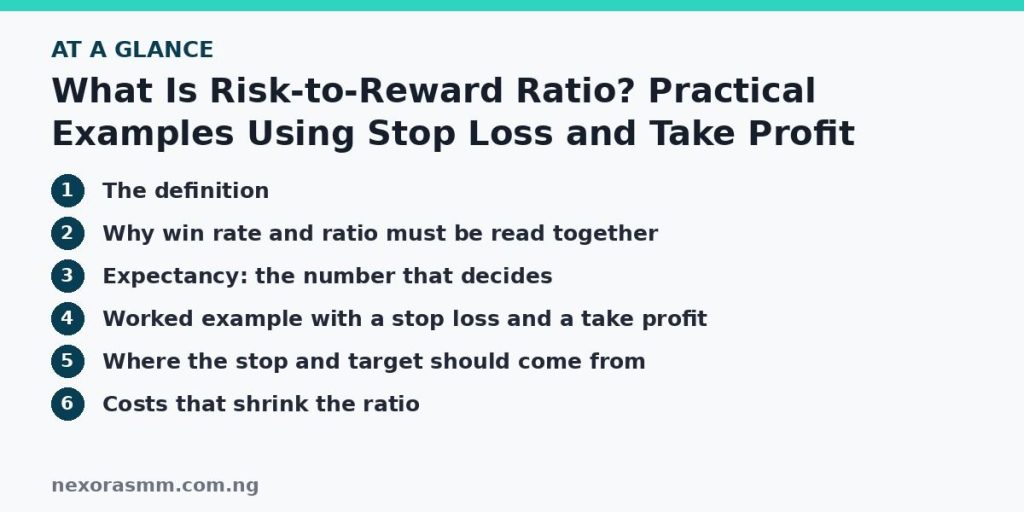
Worked example with a stop loss and a take profit
Suppose an account of $1,000 risks 1 percent, or $10, per trade.
- Entry: buy EUR/USD at 1.0850.
- Stop loss: 1.0820, below a recent swing low, which is 30 pips away.
- Take profit: 1.0910, just below a prior resistance area, which is 60 pips away.
- Ratio: 60 divided by 30 equals 1:2.
- Outcome if stopped: -$10 (-1R). If the target is hit: +$20 (+2R).
The position size is set so that 30 pips equals $10, and our guide to lot size explains how to calculate it.
Where the stop and target should come from
A common mistake is to choose the ratio first and place the stop and target to fit it. The market does not care about your 1:3. Place the stop where your setup is clearly invalid, such as beyond a swing point or beyond a support or resistance zone, and then see where a realistic target sits, such as the next significant level. If the target gives a ratio you do not accept, skip the trade. The decision to skip is part of the strategy.
Costs that shrink the ratio
Take a 20-pip stop and a 40-pip target, a planned 1:2. If the spread is 1.5 pips, your real risk is about 21.5 pips and your real reward is about 38.5 pips, which is a ratio of about 1:1.8. On a tight stop, a small spread has a large effect. Stops can also fill worse than planned during fast news moves, so your realised loss can exceed 1R.
Common mistakes
- Moving the stop further away to avoid being stopped out, which silently raises the risk.
- Taking profit early on winners but letting losers run, which reverses the planned ratio.
- Using a large ratio with a target that price rarely reaches, so the real win rate collapses.
- Judging the ratio on a handful of trades. Streaks are normal; see our guide on losing streaks.
What this article cannot tell you
- Which ratio is right for your strategy. It must be measured from many recorded trades, not chosen from a rule of thumb.
- How your broker’s spread, slippage and commission will change the numbers. Check them on your own account.
- Whether any ratio produces profit in future markets. The examples are illustrations.
Frequently asked questions
Is 1:2 the best ratio? No ratio is best on its own. What matters is the expectancy produced by your ratio and your actual win rate, after costs.
Should I always use a take profit? Not necessarily. Some strategies use trailing exits, but your exit rule should be written before you enter.
Can I risk more when I am confident? Raising size on feelings is a common cause of large losses. Decide your risk per trade in the plan and stick to it.
Key takeaways
Risk-to-reward compares the distance to your stop with the distance to your target. It only means something alongside win rate, and expectancy combines the two. Place stops and targets from market structure, include spreads in the maths and judge the ratio from many recorded trades.
Sources checked
- VT Markets, “How to Review Your Trades And Actually Improve” (expectancy worked example)
- TradingView educational posts on trading journals and performance metrics (win rate, risk-reward and expectancy)
- FXEmpire, position size and lot size calculators (risk and pip calculations)
- CrossTrade, “Backtesting Best Practices” (costs and slippage)
Educational content only — not financial advice. Income and savings results vary and are never guaranteed. How we write
Enjoyed this story?
Get the best stories delivered weekly.