Bollinger Bands Explained: What They Show and What They Cannot Predict
Last checked: 11 October 2026. This guide explains how Bollinger Bands are built and used. The bands describe volatility; they do not predict direction. Educational content only, not financial advice. Trading leveraged products such as forex and CFDs carries a high risk of loss. European regulators have reported that 74 to 89 percent of retail CFD accounts lose money, and past results never guarantee future results.
Bollinger Bands are one of the most recognisable indicators on a chart: a moving average with a band above and a band below that widen and narrow with the market. Many beginners read the upper band as “sell” and the lower band as “buy”, then lose money in a strong trend where price keeps touching the same band. This guide explains what the bands measure, how to read the squeeze and band-walking, why a touch is not a signal and how to combine the indicator with context sensibly.
How the bands are built
John Bollinger developed the indicator in the early 1980s. The standard construction has three lines. The middle band is a 20-period simple moving average of the closing price. The upper band is the middle band plus two standard deviations of the last 20 closes. The lower band is the middle band minus two standard deviations. Because standard deviation measures how spread out prices are, the bands widen when price is volatile and narrow when it is calm. The 20-period and two-deviation settings are defaults, not laws. Bollinger himself is quoted as suggesting that if you change the period you should adjust the multiplier slightly as well.
What the bands actually tell you
They give a relative definition of “high” and “low”: where price stands compared with its own recent average and volatility. If prices were normally distributed, about 95 percent would fall within two standard deviations. Financial prices are not perfectly normal, and trends can keep price near a band for a long time, so touches of the outer band are not rare events and are not by themselves signs of reversal. A band touch says price is stretched relative to its 20-bar average. It does not say what happens next.
Three things to watch
- The squeeze. When the bands contract to a low level of band width compared with that instrument’s history, volatility is compressed. Compression is often followed by expansion, but the squeeze says nothing about direction. A common mistake is to assume it does.
- Walking the band. In a strong trend, price can touch or hug the upper or lower band for many bars. In that situation, selling because price touched the upper band fights the trend.
- %B and band width. %B shows where price sits within the bands (above 1 is above the upper band, below 0 is below the lower band). Band width measures the distance between the bands and is the common squeeze gauge.
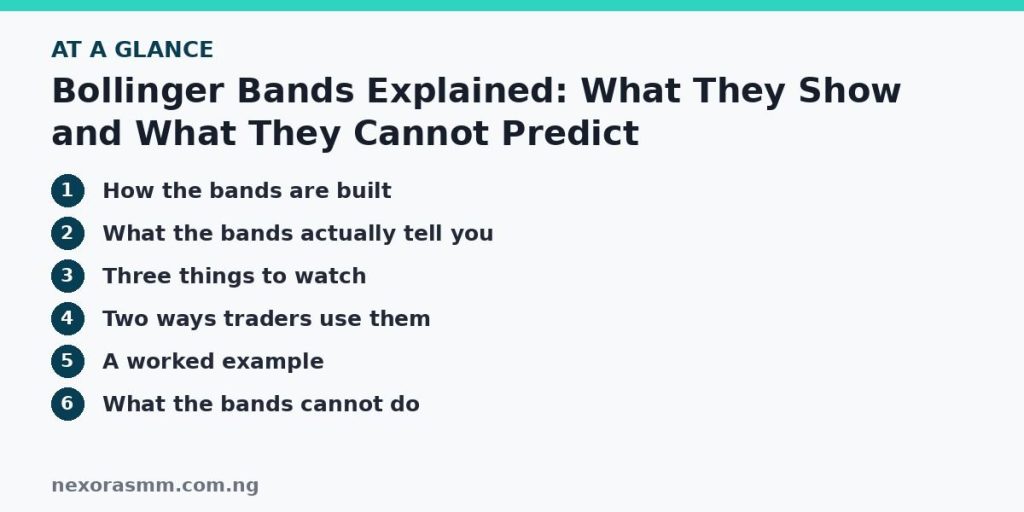
Two ways traders use them
Mean reversion in a range. When the market is ranging, price often returns toward the middle band after touching an outer band. A trader might look for a rejection candle at the band, place the stop beyond the swing extreme and target the middle band. This only suits a range, so classify the market first (see trending versus ranging markets).
Breakout or trend continuation. After a squeeze, a candle that closes outside a band with expanding band width may start a move. Because false breakouts are common, many traders wait for a close and a hold, and use the middle band as a trailing reference.
A worked example
EUR/USD is in a range on the one-hour chart. Price touches the upper band at 1.0910, which is also a marked resistance zone. A bearish rejection candle closes back inside the band. A trader sells at 1.0905, places a stop at 1.0922 (17 pips) and targets the middle band at 1.0875 (30 pips), a ratio of about 1:1.8 before costs. If price had instead been walking the upper band after a squeeze, the same touch would not have been a sell setup. The difference lies in the state of the market, not in the band.
What the bands cannot do
- Predict direction. They measure dispersion, not momentum or intent.
- Warn early. They are built from past prices, so they lag.
- Replace risk management. You still need a stop, a position size and a plan.
- Work the same everywhere. Settings that suit a daily chart may not suit a one-minute chart, and volatile instruments may need different parameters. Test any change.
Combining with other tools sensibly
Guides often suggest pairing the bands with a momentum measure such as RSI, for example a band touch with an overbought reading. This can add context but does not turn the touch into a signal, because in strong trends RSI also stays extreme. Market structure and support and resistance are usually more useful companions. See our article on combining moving averages and RSI for how to avoid cluttered charts.
Common mistakes
- Selling every upper-band touch and buying every lower-band touch.
- Using the squeeze as a direction signal.
- Tuning the settings until the past looks perfect, which is overfitting.
- Ignoring the higher-timeframe trend.
What this article cannot tell you
- Which settings are best for your instrument. That requires testing on out-of-sample data.
- How often price returns to the middle band after a touch. Results vary by market and timeframe, and I found no reliable general statistic.
- Whether a squeeze leads to a profitable breakout. It signals compressed volatility, not a trade.
Frequently asked questions
Do Bollinger Bands work in forex? They measure volatility on any liquid market, but any trading rule built on them must be tested on your instrument and timeframe.
Is a close outside the band a signal? It shows stretched price or the start of a strong move. Context decides which, so check structure and the higher timeframe.
Should I change the 20 and 2 settings? Only with evidence from testing. Otherwise the defaults are a sensible standard.
Key takeaways
Bollinger Bands are a volatility envelope around a 20-period average. They show how stretched price is, flag squeezes and help judge range or trend, but they cannot predict direction. Classify the market first, wait for confirmation and use a stop and a fixed risk on every trade.
Sources checked
- Lightspeed, “What are Bollinger Bands?”
- LuxAlgo, Bollinger Bands library entry
- FxPro, “Bollinger Bands Trading Strategy: How to Use Volatility Bands” (August 2026)
- TradeLocker, “22 Rules of Bollinger Bands”
- fffinstill, “Bollinger Bands” (squeeze direction caveat)
Educational content only — not financial advice. Income and savings results vary and are never guaranteed. How we write
Enjoyed this story?
Get the best stories delivered weekly.