How to Combine Moving Averages and RSI Without Overloading Your Chart
Last checked: 11 October 2026. This guide shows a simple division of labour between a moving average and RSI. Settings and levels are conventions to test, not recommendations. Educational content only, not financial advice. Trading leveraged products such as forex and CFDs carries a high risk of loss. European regulators have reported that 74 to 89 percent of retail CFD accounts lose money, and past results never guarantee future results.
A common beginner chart has two moving averages, a Bollinger Band, RSI, MACD and a stochastic oscillator, all asking different questions and often giving different answers. The trader is left with a list of signals and no decision. Adding indicators rarely adds information because many of them are built from the same price. A cleaner approach is to give each tool one job. This guide explains how to use a moving average for trend context and RSI for momentum timing, how to read RSI in trends versus ranges and how to test a simple combination.
Why more indicators can mean less clarity
Most indicators are derived from past price, so stacking several often repeats the same information in different forms. One trading education page specifically advises against stacking RSI with the stochastic oscillator and Williams %R, because all three measure similar exhaustion. More indicators also create conflicting signals, which invites selective reading: you notice the ones that agree with the trade you already want.
Give each tool one job
- Moving average (trend context). Is price above or below a medium-term average, and is the average sloping? Commonly used lengths are 20, 50 and 200, as simple or exponential averages. Choose one or two and keep them.
- RSI (momentum and timing). RSI compares average gains with average losses over a lookback, usually 14 periods, on a 0 to 100 scale. Readings above 70 are conventionally called overbought and below 30 oversold. The centre line at 50 separates bullish from bearish momentum.
- Price structure (decision). Support, resistance and market structure still decide where the stop and target go.
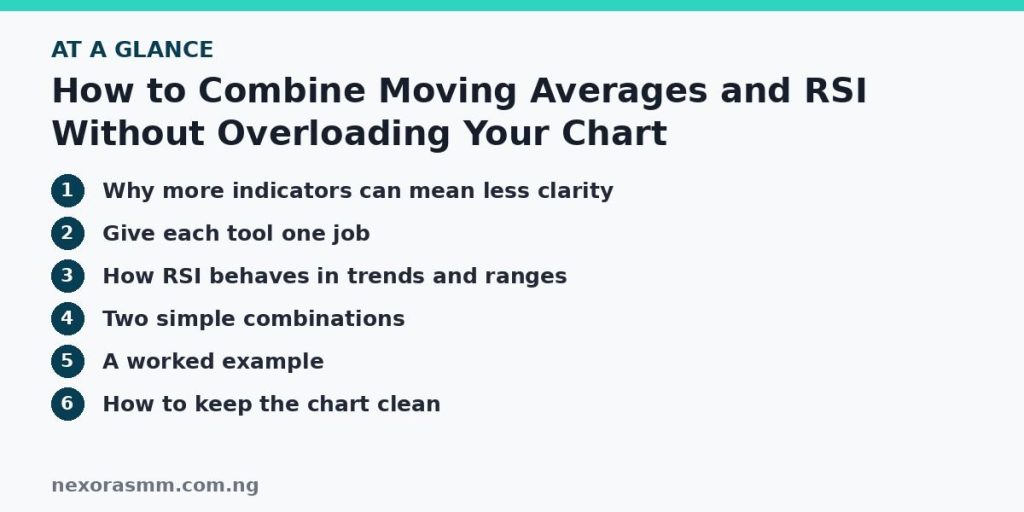
How RSI behaves in trends and ranges
The conventional readings work best in ranges. In a strong trend, RSI can stay above 70 or below 30 for long periods, so treating an overbought reading as an automatic sell is one of the most common misuses of the indicator. Education pages note that in an uptrend RSI often pulls back only to the 40 to 50 area before turning up again, and in a downtrend rallies often stall around 50 to 60. This is why a trend filter matters: it tells you which side of the RSI to respect.
Two simple combinations
- Trend pullback. Price is above a rising 50-period average (uptrend). Wait for a pullback in which RSI falls toward the lower half of its range, then enter when RSI turns up and price holds above a higher low or a support zone. The average sets direction, RSI times the pullback and structure places the stop.
- Range edge fade. The average is flat and price is bouncing between support and resistance. RSI below 30 at support, or above 70 at resistance, with a rejection candle, can support a counter-move toward the middle of the range. If the average begins to slope strongly, stop fading.
A written rule is better than a general feeling. For example: “RSI below 30 is actionable only if the daily trend is up and price is at support.” A rule such as “RSI below 30, always buy” will fail in downtrends.
A worked example
GBP/USD is trending up on the four-hour chart, with price above a rising 50 EMA and a sequence of higher highs and lows. On the one-hour chart price pulls back to a support zone near the 50 EMA. RSI drops from 68 to 44, then turns up as a bullish candle closes above the zone. The trader buys, places the stop below the pullback low, targets the previous swing high and sizes the position from that stop. If price closes below the 50 EMA and the zone, the trend condition fails and the trade is invalid.
How to keep the chart clean
- Limit yourself to one trend tool, one momentum tool and your own marked levels.
- Remove any indicator you cannot explain in one sentence: “this tells me X, and I act by doing Y”.
- Review thirty recorded trades. If winners rarely show RSI extremes, the trend filter may be doing the real work.
- Do not tweak settings to fit the last few trades.
Common mistakes
- Fading RSI extremes in a strong trend.
- Using the average as a signal on its own in a flat market, where crossovers whipsaw.
- Combining several oscillators that all say the same thing.
- Changing RSI length repeatedly instead of testing one setting.
What this article cannot tell you
- Whether any moving average and RSI combination has an edge. Published examples are descriptions, not evidence of profit.
- The best lengths for your instrument and timeframe. They need testing on out-of-sample data.
- Exact pullback levels for RSI in trends. The 40 to 50 and 50 to 60 areas are educational rules of thumb, not fixed laws.
Frequently asked questions
Is RSI 14 the standard? Yes, Wilder’s default is 14 periods, and 70 and 30 are conventions. Shorter settings give more extreme readings.
Should I use SMA or EMA? Both are used. An EMA reacts faster. Choose one and test it, rather than switching after each loss.
Can I add MACD too? You can, but ask what new information it gives. If you cannot answer, leave it off.
Key takeaways
Use a moving average to define the trend, RSI to time entries within it and price structure to place stops and targets. Know that RSI can stay extreme in strong trends, avoid stacking similar oscillators and test any combination before trading it with real money.
Sources checked
- Trade-Ideas, “Relative Strength Index (RSI) Explained”
- Bit.com Knowledge Hub, “Overbought and Oversold”
- Bitfinex blog, “Chart Decoder Series: RSI”
- StockSharp, “RSI + EMA Trend Strategy” documentation (an example of a coded combination, not evidence of profit)
- Lightspeed, “What are Bollinger Bands?” (using RSI as confirmation)
Educational content only — not financial advice. Income and savings results vary and are never guaranteed. How we write
Enjoyed this story?
Get the best stories delivered weekly.