Why a Good Entry Can Still Lose: Understanding Probability and Losing Streaks
Last checked: 11 October 2026. This guide uses simple probability to explain losing streaks. The calculations assume independent trades, which real markets only approximate. Educational content only, not financial advice. Trading leveraged products such as forex and CFDs carries a high risk of loss. European regulators have reported that 74 to 89 percent of retail CFD accounts lose money, and past results never guarantee future results.
You waited for the setup, the trend was clear, your stop was logical and the trade still lost. Then the next one lost too. It is natural to conclude that the strategy stopped working, or that you did something wrong. Sometimes that is true. Often it is simply how probability behaves. A good entry is one that follows your tested rules and has positive expectancy over many trades, not one that always wins. This guide explains outcomes versus decisions, shows how likely losing streaks are, links them to drawdown and risk and gives a way to judge whether a run of losses is normal or a warning.
Decision quality and outcome quality
A single trade outcome is a mix of your decision and chance. Poker players separate the two: you can make a good decision and lose, or make a poor decision and win. Trading works the same way. If your plan says the setup wins 45 percent of the time with winners worth 1.5 times the risk, the expected result per trade is positive, yet 55 percent of those trades will still lose. A loss after following the plan is the expected cost of doing business. A win after breaking the plan is a bad habit that happened to pay.
How likely is a losing streak?
If each trade is independent and the chance of a loss is q, the chance of losing k trades in a row, starting from a given trade, is q to the power k. Using a 40 percent win rate (a 60 percent loss rate), a 50 percent win rate and a 60 percent win rate:
- Three losses in a row: about 22 percent at a 40 percent win rate, 12.5 percent at 50 percent and 6.4 percent at 60 percent.
- Five in a row: about 7.8 percent, 3.1 percent and 1.0 percent.
- Seven in a row: about 2.8 percent, 0.8 percent and 0.16 percent.
- Ten in a row: about 0.6 percent, 0.1 percent and 0.01 percent.
These look small, but you take many trades. Over 100 trades, a system with a 40 percent win rate can be expected to see its longest losing streak at around seven. At 50 percent, the longest streak over 100 trades is typically five to six. Over 200 trades, the typical longest streaks grow to roughly 8 to 9 and 6 to 7. So a streak of five or six losses is not proof the strategy is broken, even at a 50 percent win rate.
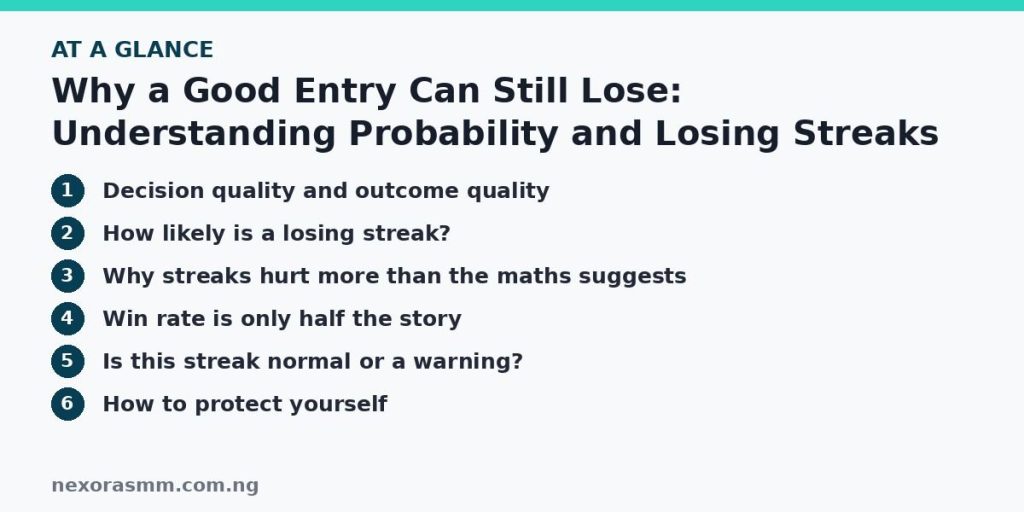
Why streaks hurt more than the maths suggests
Drawdown compounds. If you risk 2 percent per trade, ten straight losses reduce the account by about 18 percent, to around $817 from $1,000. At 10 percent risk, the same sequence leaves about $349. A 20 percent drawdown needs a 25 percent gain to recover and a 50 percent drawdown needs a 100 percent gain. Emotional pressure also grows with each loss, which is when traders break rules, raise size or skip valid setups after a loss and then take poor ones. Position sizing is therefore the main protection against streaks. Our guides on lot size and on why traders lose cover it.
Win rate is only half the story
A strategy with a 40 percent win rate and a 1:2 ratio has an expectancy of +0.20R per trade. A strategy with a 60 percent win rate and winners worth 0.5R has an expectancy of -0.10R. The first strategy will lose more often but make money, and its streaks will be longer. Know your own win rate and average win and loss before judging a run of losses. See our article on risk-to-reward ratios.
Is this streak normal or a warning?
- Check the sample. Have you followed the rules on every trade in the streak? If not, the streak is a behaviour problem, not a strategy problem.
- Compare with your records. What is the longest losing streak in your backtest and in your journal? If the current streak is inside that range, it is within expected variation.
- Look for a change in conditions. Has the market moved from trending to ranging, or has volatility changed in a way your setup does not handle?
- Check costs. A wider spread or a new broker can change results.
- Set a pre-agreed review trigger. For example, if drawdown exceeds the worst backtested drawdown by a set margin, pause live trading and review. Decide the rule in advance, not mid-streak.
How to protect yourself
- Risk a small fixed percentage so that a streak you cannot rule out will not end the account.
- Set a daily loss limit and stop for the day when you reach it.
- Do not change the strategy because of three or four losses; judge it on a large sample.
- Keep a journal so you can tell rule-following losses from rule-breaking losses.
Common mistakes
- Doubling the size after a loss to recover faster, which makes the next streak more damaging.
- Abandoning a strategy after a normal streak and moving to another, never collecting enough data on any of them.
- Judging a strategy on 10 or 20 trades. One backtesting guide notes that a strategy that looks great over 30 trades is statistically meaningless.
- Believing a win is due after a run of losses. If trades are independent, each trade has the same odds.
What this article cannot tell you
- Your own win rate or expectancy. These need to be measured from many recorded trades under your rules.
- Whether trade outcomes in real markets are truly independent. Results can cluster when market conditions change, so the streak figures are approximations.
- How many trades make a reliable sample. Guides give different numbers, and it depends on how variable your results are.
Frequently asked questions
Does a losing streak mean my strategy stopped working? Not necessarily. Compare it with the streaks in your test and journal, and check whether you followed your rules.
Is a high win rate safer? It gives shorter losing streaks, but profit also depends on the size of wins and losses.
Should I reduce size during a streak? Some traders do, and some plans include a rule to cut risk after a set drawdown. Write the rule in advance if you use it.
Key takeaways
A good entry is one that follows a tested plan, not one that always wins. Losing streaks are a normal part of any strategy, and even a 50 percent win rate can produce five or six losses in a row over 100 trades. Protect the account with small fixed risk, compare streaks with your recorded history and never judge a method on a handful of trades.
Sources checked
- CrossTrade, “Backtesting Best Practices” (sample-size caution)
- VT Markets, “How to Review Your Trades And Actually Improve” (expectancy)
- TradeZella, weekly trade review process (win rate compared with a baseline)
- Streak probabilities, drawdown recovery and compounding figures are my own calculations assuming independent trades
Educational content only — not financial advice. Income and savings results vary and are never guaranteed. How we write
Enjoyed this story?
Get the best stories delivered weekly.