Trending vs Ranging Markets: How to Recognize the Difference

Last checked: 11 October 2026. This guide explains simple ways to classify a market as trending or ranging. No method is perfect, and markets switch between states. Educational content only, not financial advice. Trading leveraged products such as forex and CFDs carries a high risk of loss. European regulators have reported that 74 to 89 percent of retail CFD accounts lose money, and past results never guarantee future results.
A strategy that works beautifully in a strong trend can lose steadily in a sideways market, and the reverse is also true. That is why one of the most useful questions before a trade is not “where do I enter?” but “what kind of market is this?” Traders who skip the question often use a trend-following method in a range, get stopped out repeatedly and conclude that their strategy is broken. This guide shows how to tell the two states apart using structure, moving averages, volatility and a few simple checks.
What the two states look like
Trending market. Price makes a sequence of higher highs and higher lows, or lower highs and lower lows. Pullbacks are shallow compared with the main moves, and price stays mostly on one side of a medium-term moving average.
Ranging market. Price moves between a fairly horizontal support and resistance. Swing highs and lows overlap, moving averages flatten and criss-cross price, and breakouts often fail.
Five practical checks
- Read the structure. Mark the last four to six swing points. Two or more clear higher highs and higher lows, or the reverse, point to a trend. Overlapping swings point to a range. Our article on market structure explains the labels.
- Look at a moving average. A 50-period average that is clearly sloped, with price repeatedly staying on one side, suggests a trend. A flat average that price crosses back and forth suggests a range.
- Check volatility. Narrow Bollinger Bands, a contraction in band width, indicate compressed volatility. Wide bands that price walks along suggest a strong move. Our article on Bollinger Bands covers this.
- Consider a trend-strength indicator. Some traders use the Average Directional Index (ADX) as a filter, trading trend strategies only when it shows strength. Thresholds vary between traders, so test your own and do not assume one number works everywhere.
- Zoom out. A range on a five-minute chart may be a small pause inside a strong hourly trend. Always note the higher-timeframe state.
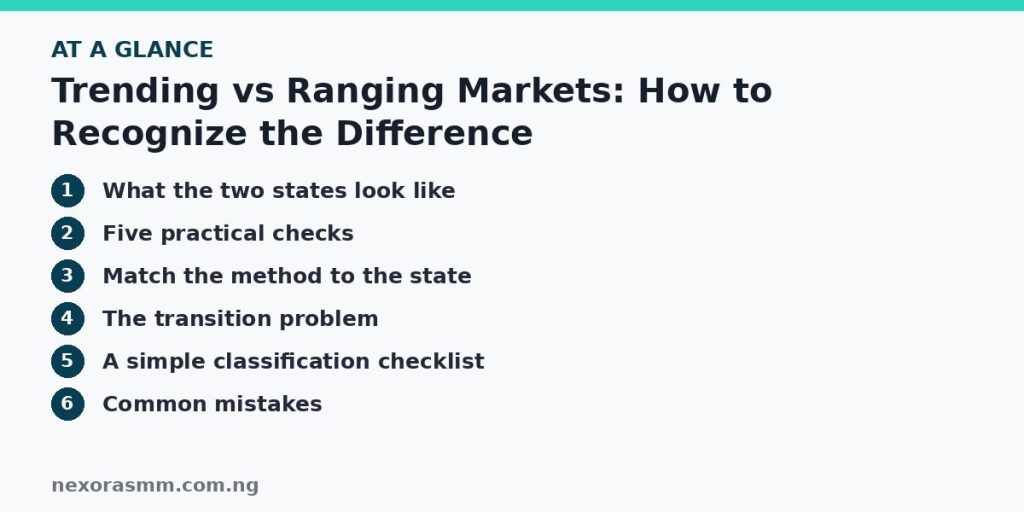
Match the method to the state
- In a trend, traders usually look for pullbacks to a support zone, a moving average or a higher low in an uptrend, then trade in the direction of the trend with a stop beyond the pullback.
- In a range, traders may fade the edges, selling near resistance and buying near support, with stops beyond the range and targets near the middle or the opposite edge.
- When unclear, the best trade may be none. A written rule such as “if I cannot name the state in ten seconds, I wait” prevents forced entries.
The transition problem
Markets move from range to trend and back, and the change is easy to see only afterwards. A tight range often ends with a breakout, but many breakouts fail and return into the range. Waiting for a close beyond the range and a retest that holds reduces this risk, though it does not remove it. Our guide to liquidity sweeps explains why price sometimes pokes through a range edge and reverses.
A simple classification checklist
Before each trade, write one line in your journal: “Higher timeframe: uptrend. Trading timeframe: range between 1.0850 and 1.0910.” Then choose the strategy that fits. After a few weeks you will see which states your strategy handles well. If it loses in ranges, add a filter that blocks entries when the average is flat.
Common mistakes
- Buying every dip in what is actually a downtrend, because the price looks cheap.
- Selling every spike in a strong uptrend because an oscillator looks overbought.
- Using a tight range strategy right before a scheduled news release.
- Changing definitions after a loss to justify a trade.
What this article cannot tell you
- A single objective rule that classifies every market correctly. All methods lag and misclassify at times.
- Which ADX level or moving average setting suits your instrument. That needs testing on your own data.
- Whether a breakout will hold. Many fail, and I found no reliable statistic for forex.
Frequently asked questions
Can a market be both trending and ranging? Yes, on different timeframes. A daily uptrend can contain a four-hour range.
Which is easier to trade? Neither is easy. Trends reward patience and staying in winners. Ranges reward quick, disciplined exits.
Do I need an indicator? Not necessarily. Many traders classify with structure alone and use an average or ADX only as confirmation.
Key takeaways
Classify the market before choosing a method. Use structure, a moving average, volatility and the higher timeframe to decide whether price is trending or ranging, match your approach to that state and be willing to stand aside when the state is unclear.
Sources checked
- TheRightTrader, “Market Structure and Break of Structure”
- LuxAlgo, Bollinger Bands library entry and market structure articles
- Lightspeed, “What are Bollinger Bands?” (squeeze and band-walking in strong trends)
- TradingView script descriptions mentioning ADX filters for trending and ranging conditions
- Trade-Ideas, “Relative Strength Index (RSI) Explained” (context from trend and ADX)
Educational content only — not financial advice. Income and savings results vary and are never guaranteed. How we write
Enjoyed this story?
Get the best stories delivered weekly.